Connecting the Dots
Strategies for assessing air pollution may use a combination of measurements, models, and satellite data. There are extensive options for investigating air quality issues, and we have provided a list that examines data and tools relevant to air quality from local to global scales. Categorized by user accessibility, this list provides a brief description and strength for each dataset or tool.
User Friendly Data and Tools
Daily and Seasonal TROPOMI NO2 in United States 🇺🇸
NO2 tropospheric vertical column amounts observed by TROPOMI. Good for: Looking at daily or seasonal TROPOMI NO2 as well as trends over time.
Average Annual Fine Particulate Matter (2011-2015) in the United States 🇺🇸
Average PM2.5 values at the census tract level compared with demographic composition. Good for: Quick look at local average annual PM2.5.
Current air quality index in the United States and parts of Canada 🇺🇸
Air quality index (AQI) value for ozone and particulate matter from regulatory monitors. Good for: Looking at past, current, forecast air quality one day at a time.
Current AQI across the world from IQAir 🌎
AQI values, locations of fire, and wind patterns from a proprietary, low-cost ground monitoring network. Good for: Looking at current global air quality index values.
Current AQI for PM2.5 from PurpleAir 🌎
Current PM2.5 values from individuals who have purchased an at home monitor from proprietary, low-cost ground monitoring network. Good for: Quick look at hyper local PM2.5 air quality.
Current AQI readings and more from Breezometer 🌎
Current values of PM2.5, PM10, O3, NO2, SO2, and CO from ground measurements and satellite data. Good for: Current readings of some of the criteria air pollutants and fire locations in the world.
Average air quality indicators in the United States 🇺🇸
Environmental justice indicators, pollution sources, and socioeconomic indicators from the EPA. Good for: Comparing environmental indicators to different socioeconomic indicators.
Pollution averages from 2018-2020 in each county across the United States 🇺🇸
Ozone, particulate matter, and groups at risk from the EPA. Good for: Comparing the pollution and groups at risk in your city to a different city.
Five years (2014-2018) of industrial pollution data in the United States 🇺🇸
Industrial air pollution estimated from EPA air toxic emissions. Good for: Looking at industrial, cancer-causing pollution hotspots in the United States and estimating risk.
The average over three years in California for equity metrics and pollutant concentration, including health 🇺🇸
Exposure, environmental effect, sensitive population, and socioeconomic indicators from different local and federal agencies. Good for: Comparing pollution burden to different population characteristics such as low birth rate or poverty.
Environmental Justice Mapping in Colorado 🇺🇸
Environmental justice mapping tool that uses population and environmental factors to calculate an “EnviroScreen score.” A higher score indicates an area is more likely affected by environmental health injustice. Good for: Identifying disproportionately impacted communities in Colorado.
Current Air Pollution Sites in Colorado 🇺🇸
Pollution source site information combined with socioeconomic and environmental health data, at the census block group level. Good for: Examining air pollution sources in Colorado in comparison with local socioeconomic and exposure data.
Intermediate Data and Tools
Daily data for flexible analysis from EPA 🇺🇸
Regulatory monitoring data for criteria air pollutants, along with various download and visualization options. Good for: Looking at pollution concentrations or changes in average air pollution at a specific location, county, or state.
Daily and hourly data for flexible analysis from EPA 🇺🇸
EPA monitoring data with an interface for more powerful analysis. Good for: Professional air quality analysts (requires login).
Satellite images for the whole Earth 🌎
Satellite data from NASA. Good for: Looking a wide range of satellite data on individual days, including air pollution data products.
Transport and dispersion model for the entire Earth at any time 🌎
A model from the NOAA that provides backwards trajectories, forward trajectories, and dispersion simulations using meteorological data. Good for: Predicting where air pollution may have traveled to or from during an air pollution episode.
Global Earth science data, current and past 🌎
Global satellite data from NASA. Good for: Creating plots and visualizing earth science data pertaining to aerosols, meteorology, and climate from both observations and models.
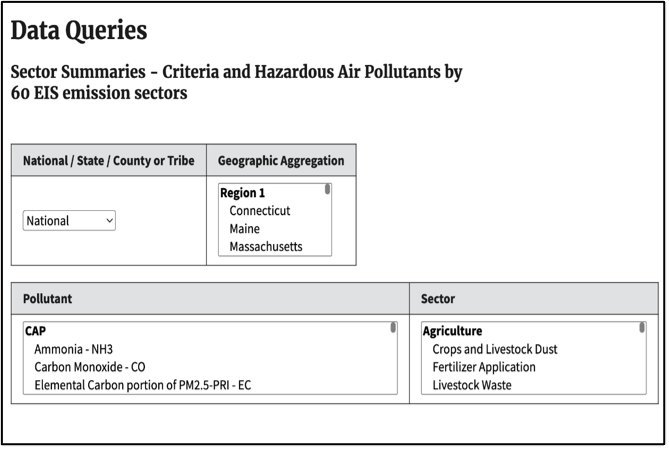
Emissions inventories produced every three years with a query tool for users to specify the scale (national, regional, state, or county), the pollutant, and the sectors to include 🇺🇸
All emissions (criteria, hazardous, greenhouse gas, and others) from EPA data. Good for: Filtering emissions by geographic scale and/or sector and/or year.
The model (InMAP) can be used to estimate changes in annual average fine particulate matter 🌎
Developed by university researchers, InMAP calculates annual average PM2.5 at resolutions supporting environmental justice assessment. Good for: Estimating changes in fine particulate matter from “what-if” policy scenarios.
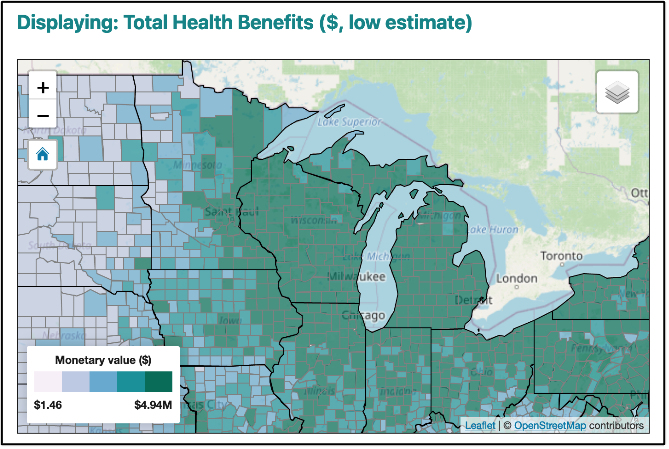
The model (COBRA) estimates pollution reductions and resulting health benefits 🇺🇸
Developed by EPA, COBRA calculates annual average PM2.5 at the county-scale. Good for: Estimating changes in fine particulate matter from “what-if” policy scenarios in the U.S.
Annual air pollutant statistics from AirBase and AQ E-Reporting 🇪🇺
Air pollutant concentration data with an interface for queries and filtering. Good for: Downloading annual data for countries in Europe.
Advanced Data and Tools
Year-long emissions inventories of criteria air pollutants, greenhouse gases, and hazardous air pollutants 🇺🇸
Spatial analysis of EPA data, via cumbersome platform or downloaded to GIS. Good for: Mapping emissions and their sources.
Daily and hourly data for the entire U.S. 🇺🇸
Using Python or other analysis tools allows customized analysis beyond the web-based tools above (the image shows the locations of monitors reporting data in 2020).
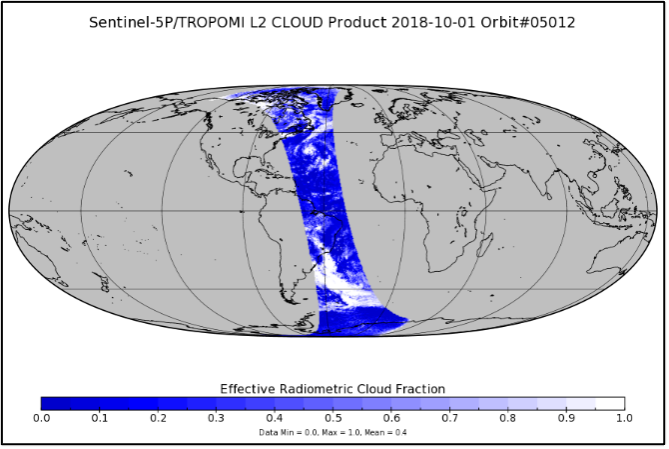
Global data available daily from 2019 - present 🌎
Tropospheric vertical column densities of nitrogen dioxide from highest resolution instrument in orbit. Good for: health risk and indicator of fossil fuel combustion (also provides SO2, HCHO, and other metrics. “Level 2” refers to the satellite data processed into air quality metrics, at the native resolution of the instrument.)
Pre-defined or custom gridded data 🌎
Same as Level-2, but allocated to a grid for easier analysis. Other satellite products follow the same Level-2, Level-3 terminology. Good for: Comparing satellite data to ground-based measurements or air quality models. Boost resolution by averaging data over time.
Allocated to non-grid areas of interest 🇺🇸
1km x 1km TROPOMI NO2 data allocated to census tracts and U.S. counties available as shapefiles. Good for: Analyzing NO2 data in GIS and comparing satellite data to monitor data.
Global annual and monthly data from 1998-2020 🌎
High resolution (0.01° x 0.01°) gridded data available in netCDF and ASCII format. Good for: Analyzing PM2.5 data in GIS and comparing satellite data to monitor data. Intended to aid in large-scale studies.
Local to hemispheric scales with a resolution of ~1km x 1km to ~36km x 36km 🇺🇸
Ozone, PM and other air toxins. Good for: Modeling toxic air pollutants, exploring pollution trends and climate change applications.
Local to global scales 🌎
Incorporates meteorological conditions and emission inventories to model atmospheric compositions. Good for: Simulating chemical formation, deposition, transportation, and loss.
Models air pollution concentrations from a point source 🇺🇸
CO, SO2, NO2, PM, lead and air toxins. Good for: Short range air quality analysis (up to 50 kilometers) and EPA approved.
Models air pollution concentrations from a point source 🇺🇸
Criteria pollutants. Good for: Assessing long range (up to 200 km) transport of pollutants.


