Connecting the Dots
The Holloway Group is committed to growing the resources available for those interested in learning air quality research skills. Assessing air pollution and its impacts can require a variety of new software and programming languages, and to assist those learning some of these tools, we have developed step by step tutorials. Each tutorial is briefly described below.
Tutorials
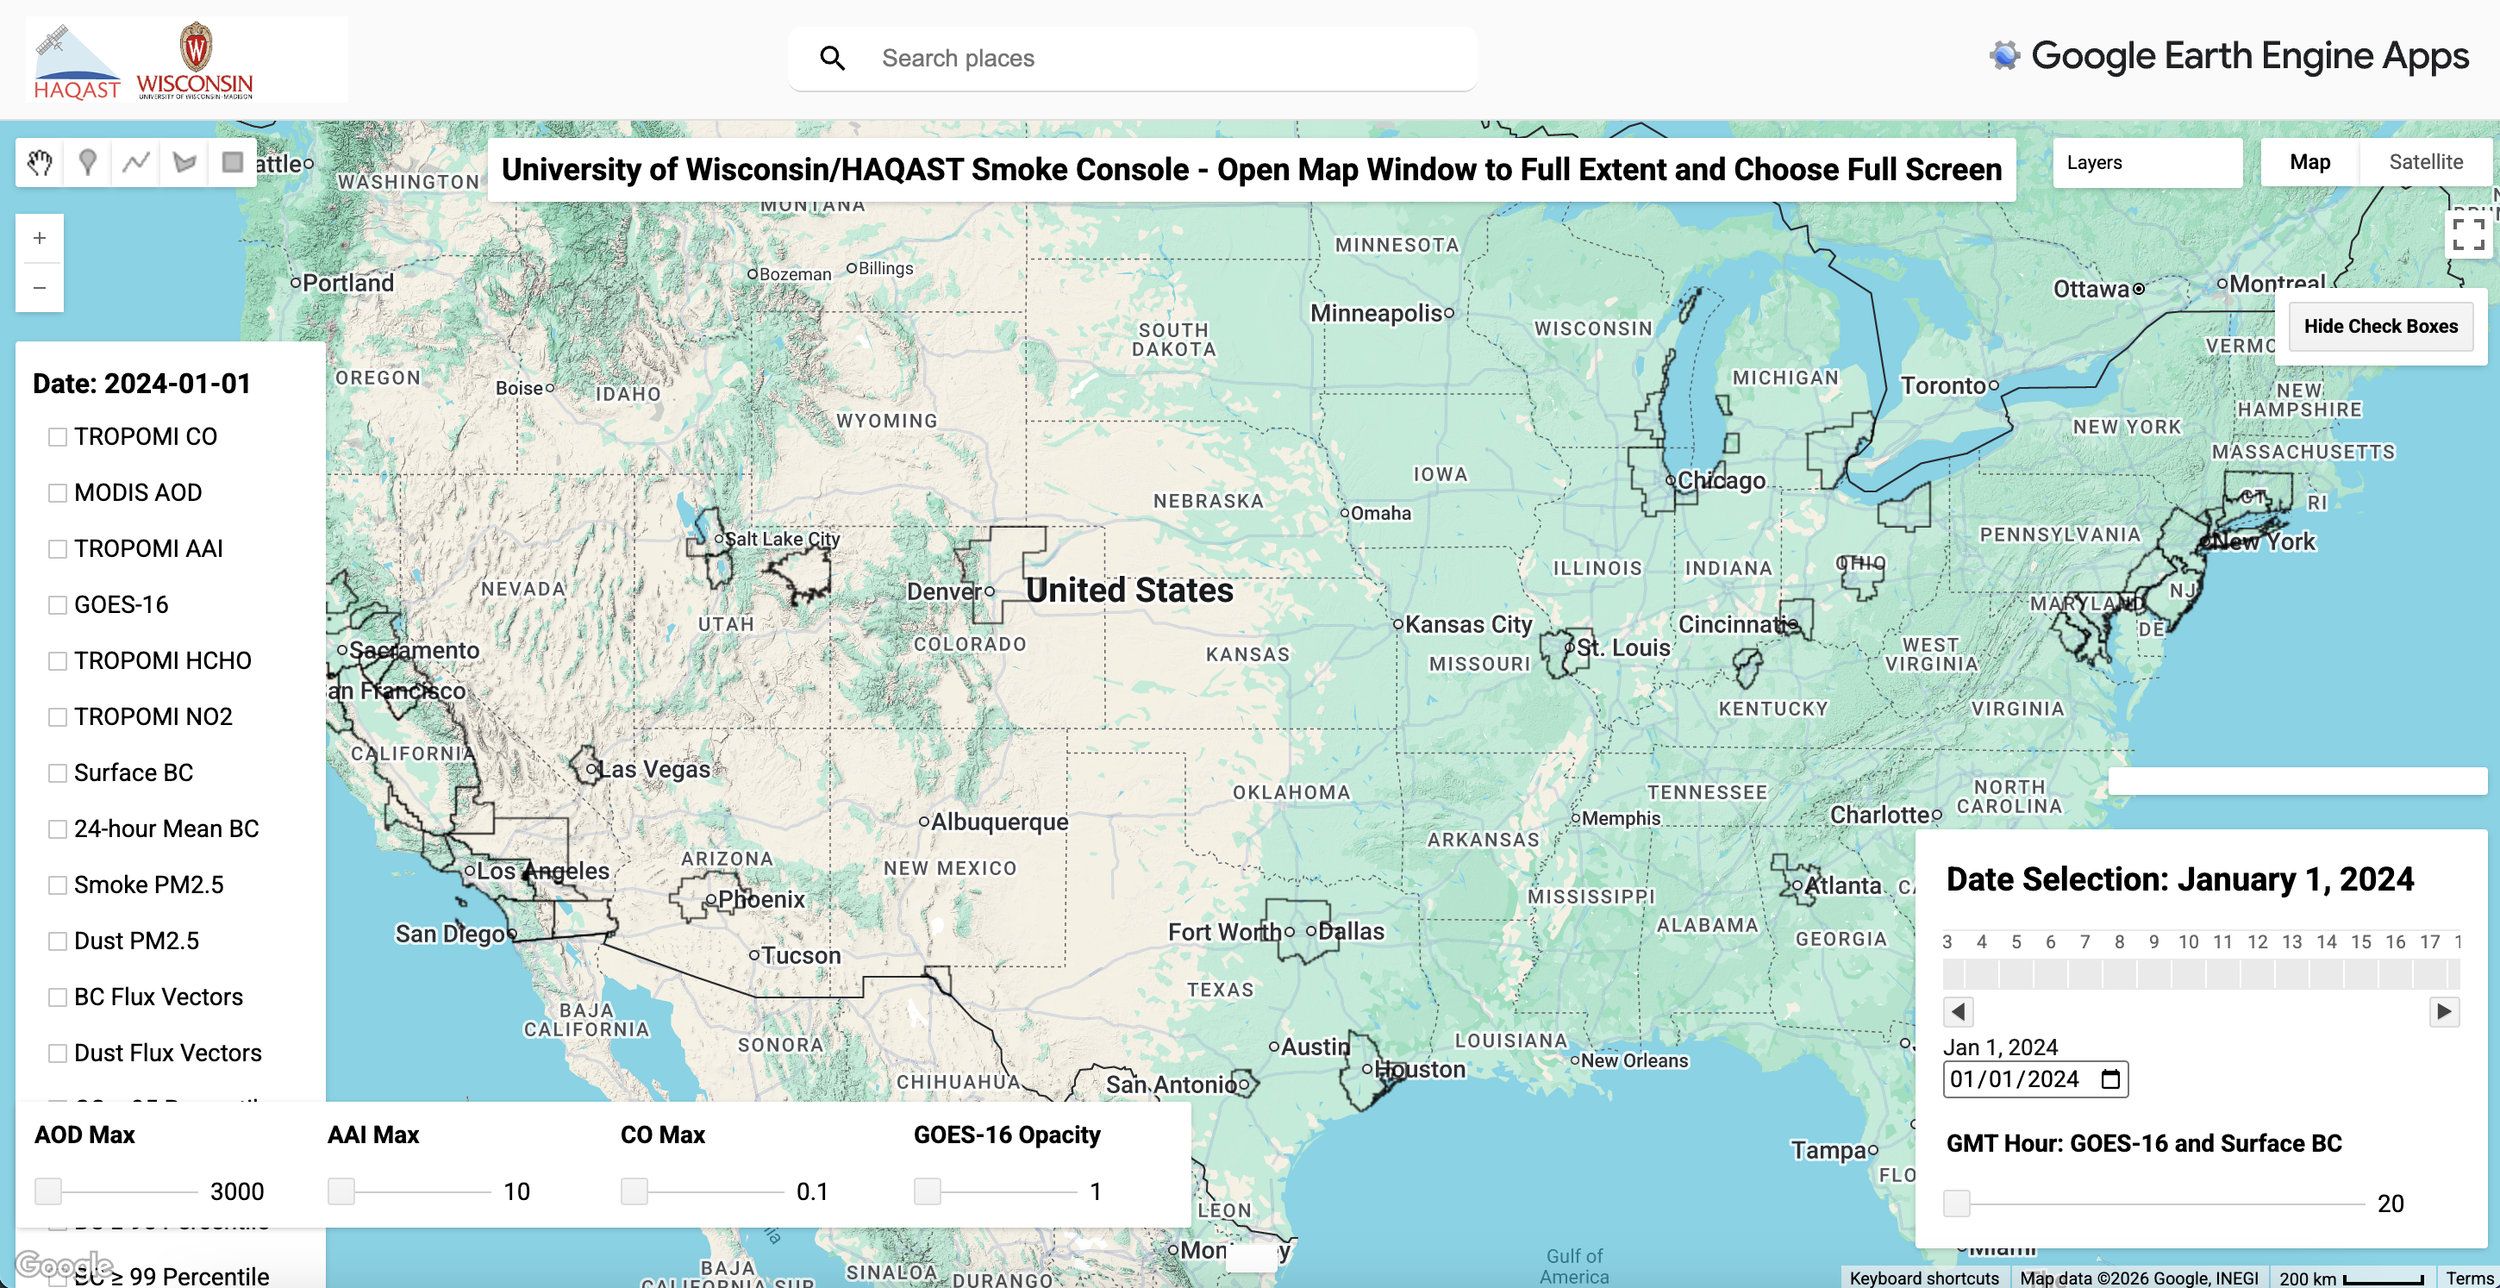
A tutorial on HAQAST Smoke Console to visualize and analyze data, including TROPOMI CO, NO₂, HCHO, MODIS AOD, MERRA-2 black carbon and dust flux vectors, visible satellite imagery, and surface air quality observations.
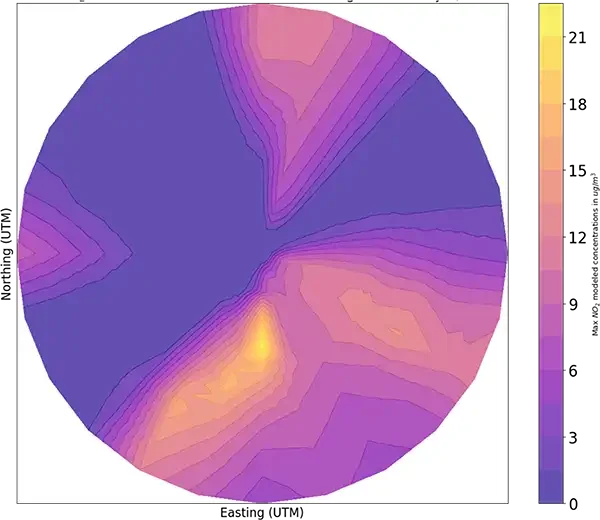
A tutorial on un AERMOD and use its outputs for health impact assessment.
A tutorial on how to download the Washington University in St. Louis (WashU) satellite derived particulate matter (PM2.5) data and upload it into Google Colab.
A tutorial to accessing and retrieving relevant environmental justice data, understanding how the EPA defines low-income disadvantaged communities (LIDACs), and connecting LIDACs with EJScreen data using Geographic Information Systems (GIS).
A tutorial walkthrough for using Google Earth Engine (GEE) to create a nitrogen dioxide (NO2) concentration time series chart. Users will write a script that retrieves data from the Copernicus Sentinel-5 Precursor satellite's TROPOspheric Monitoring Instrument (TROPOMI) using the GEE Code Editor.
A tutorial for mapping gridded (Level-3) TROPOMI NO2 with ArcGIS Pro, both as the gridded product and as allocated to census tracts. Users will gain experience with common tools that can be useful in GIS-based air quality analysis such as clipping, filtering, and allocating data from one format to another.
Designed for undergraduate and graduate students with no or minimal prior coding experience, these atmospheric and geophysical science Python tutorials are targeted toward students with an interest in air quality and the atmospheric sciences.
User friendly tutorials using Google Earth Engine to plot the ratio of formaldehyde to nitrogen dioxide that can be used to assess ozone sensitivity.


