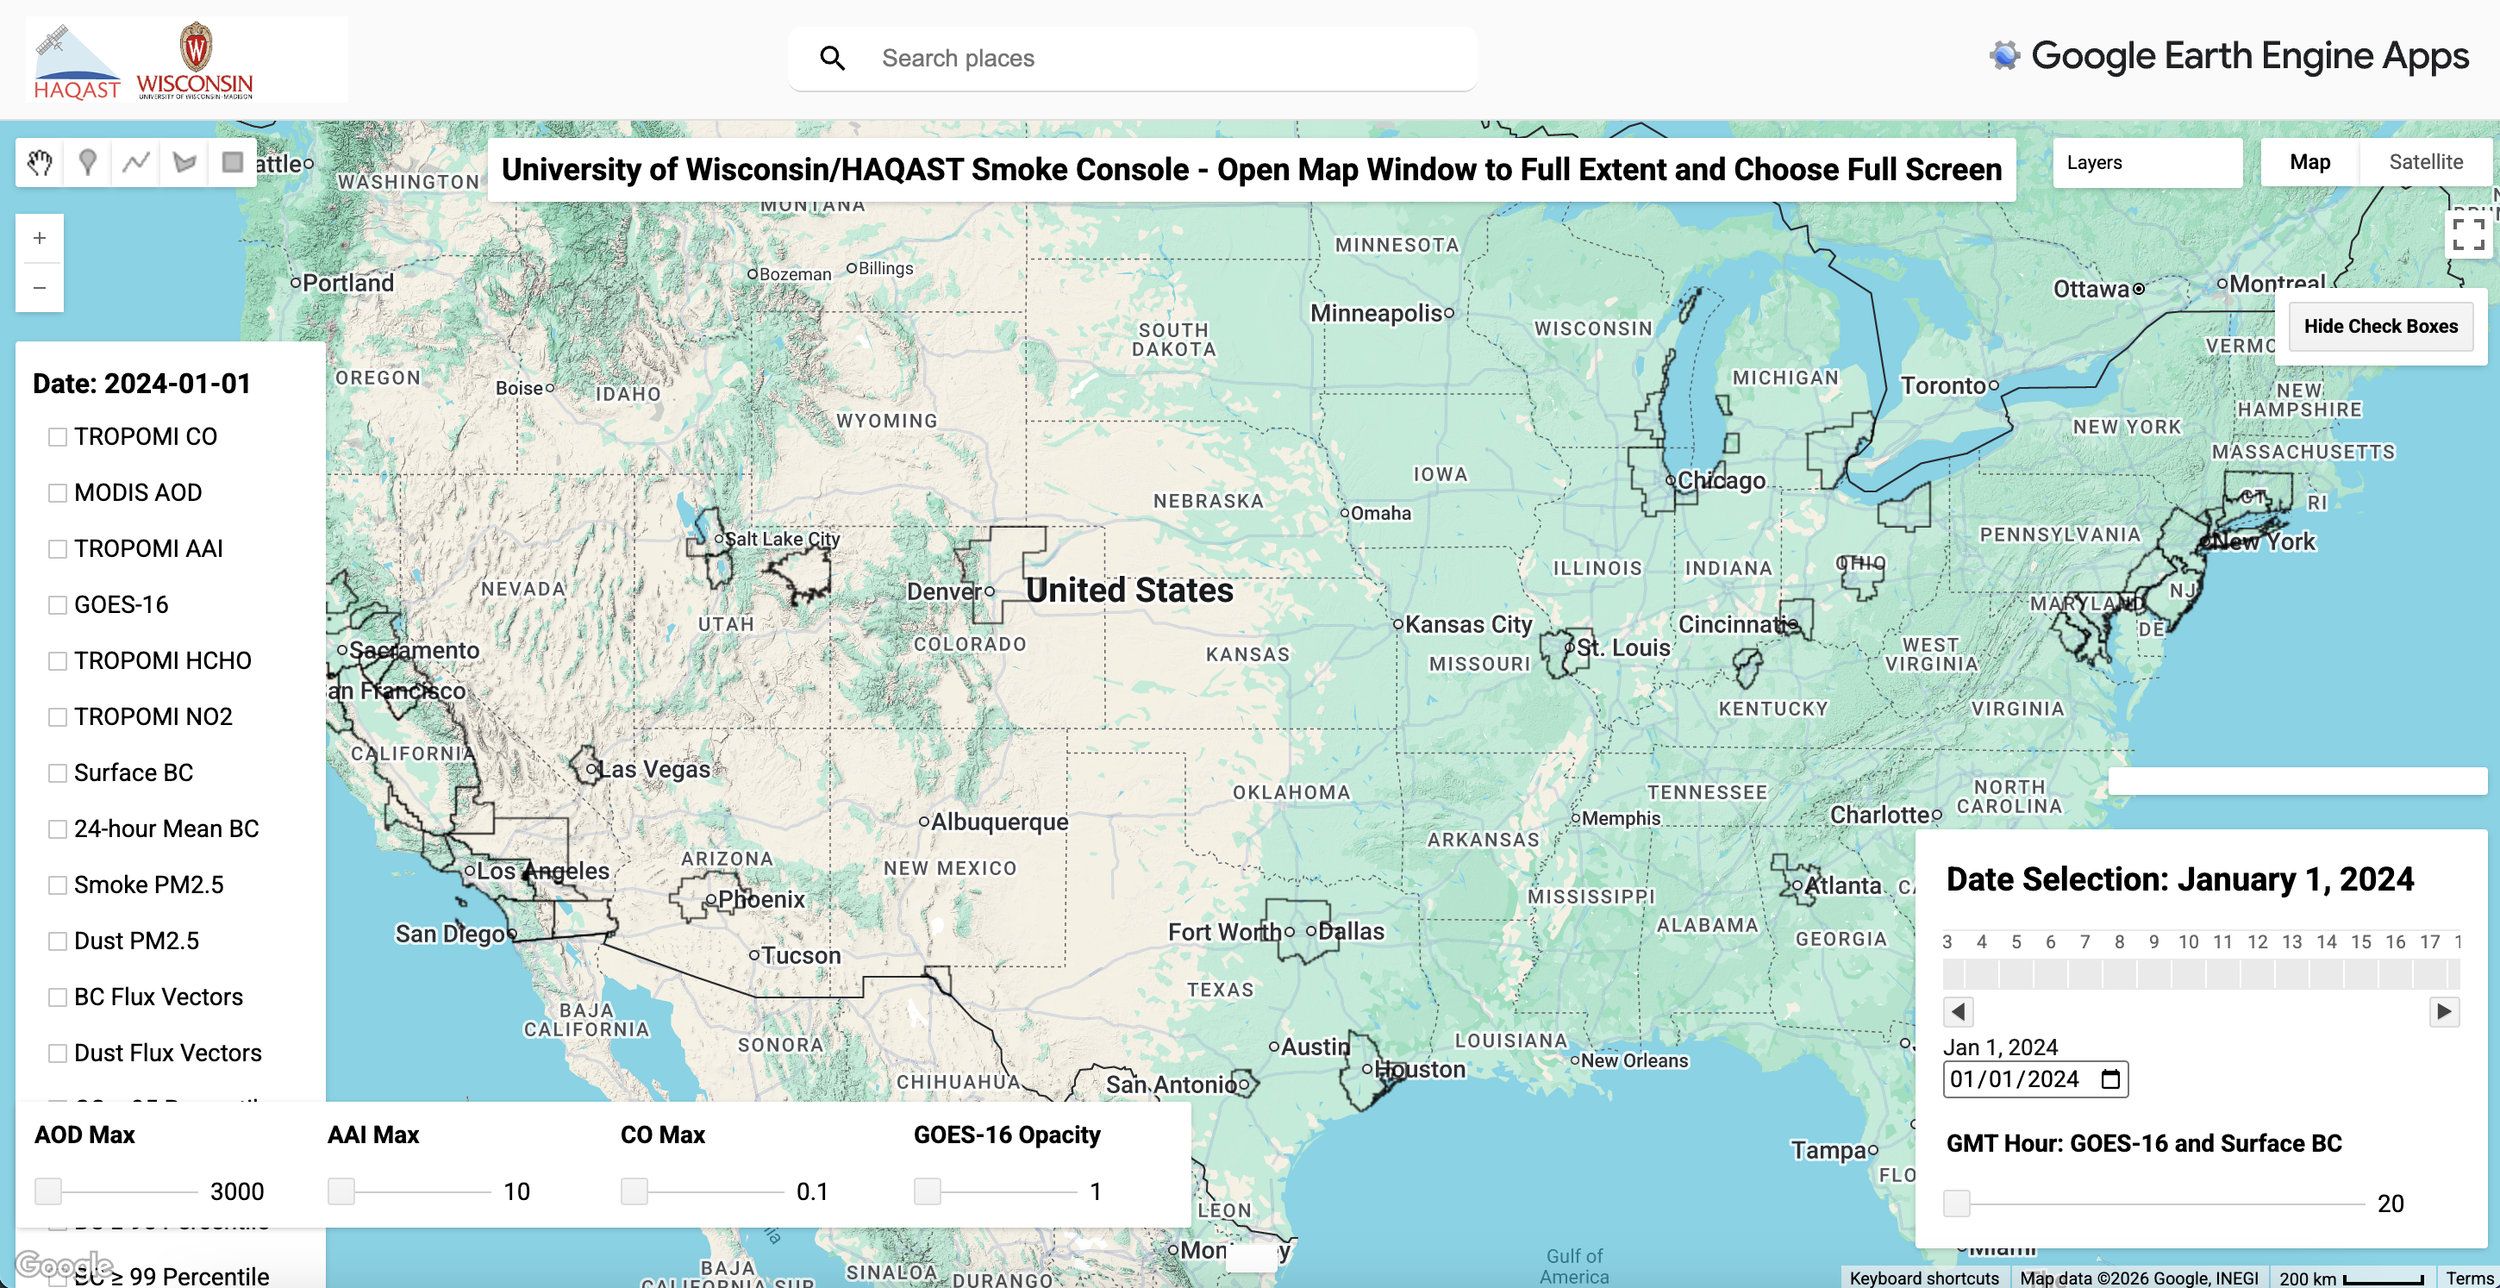
A tutorial on HAQAST Smoke Console to visualize and analyze data, including TROPOMI CO, NO₂, HCHO, MODIS AOD, MERRA-2 black carbon and dust flux vectors, visible satellite imagery, and surface air quality observations.

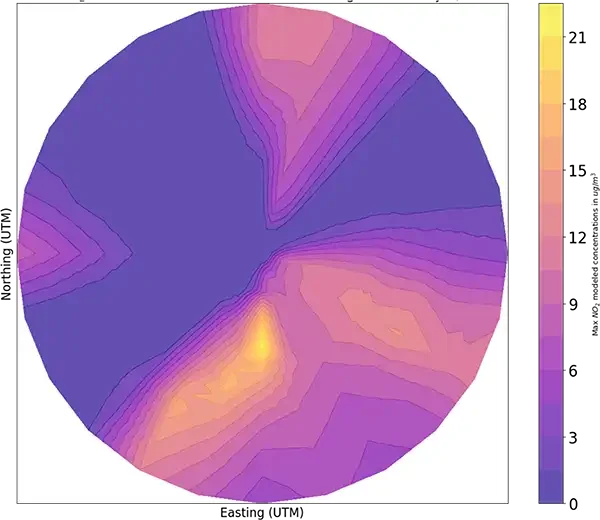
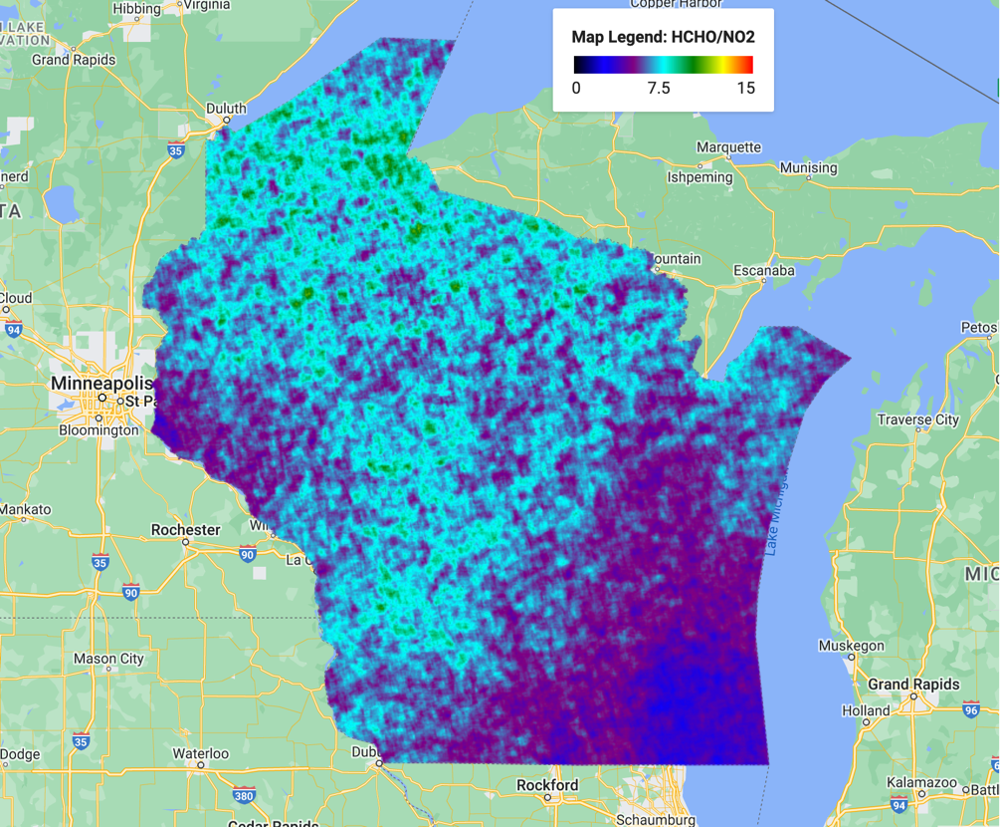
A tutorial for mapping gridded (Level-3) TROPOMI NO2 with ArcGIS Pro, both as the gridded product and as allocated to census tracts. Users will gain experience with common tools that can be useful in GIS-based air quality analysis such as clipping, filtering, and allocating data from one format to another.